How can we help you?
Initially, with 15 years of experience investing and actively trading in the stock market, our team (Denis Suchilin - team leader) created a dashboard that would gather all the information about what's happening in the stock market on a single screen—and most importantly, in a clear, understandable format:
- the results of our bots' analysis of the actions of various market participants in the order books: from insiders and non-residents to the bots of professional market participants who manipulate markets, moving prices. Here, we wanted to see which financial instruments insiders (we'll call them key market participants) were building long-term positions in, and which ones they were disposing of;
- the information we received from our "discoveries" in technical analysis (recurring patterns that are highly likely to be followed by a rise or fall in the market)—and here, we wanted to see in which stocks, currencies, commodities, and cryptocurrencies these patterns were currently triggered; We wanted the dashboard's real-time information to tell us which financial instruments were worth speculatively entering and which positions were worth exiting;
- market inefficiencies that had persisted for a long time and allowed us to profit from them; in this case, we wanted our robots to promptly alert us to the emergence of such inefficiencies in the market.
We wanted to be the first to see when market sentiment shifts, as well as demand from each type of participant, which we had learned to identify based on their behavior patterns in order books.
We wanted to see the behavior of key market participants in terms of long-term investment and intraday speculative actions. The behavior patterns of the key participants' robots in these two cases are completely different, and thanks to our knowledge, we were able to identify them.
We wanted to see what the average market participant doesn't see, and what key market participants try to "hide": for example, the giveaway of shares during a market rally before a crash, or, conversely, their gradual buying of shares when the market and most participants panic and sell those same shares at a loss.
Below, using PIKK shares as an example, we can clearly see the change in Key Stakeholder Sentiment (in this case, interest from, most likely, insiders) over time: from a multi-month positive trend to a strong negative trend (the blue "wave" abruptly reverses and goes negative) at the end of September 2021. Immediately after a few days, we see the share price (gray line) begin to decline rapidly, ultimately leading to a drop from 1,500 rubles by almost -40% by the beginning of the following month (because there was no "interest"/demand from key participants; it had disappeared):
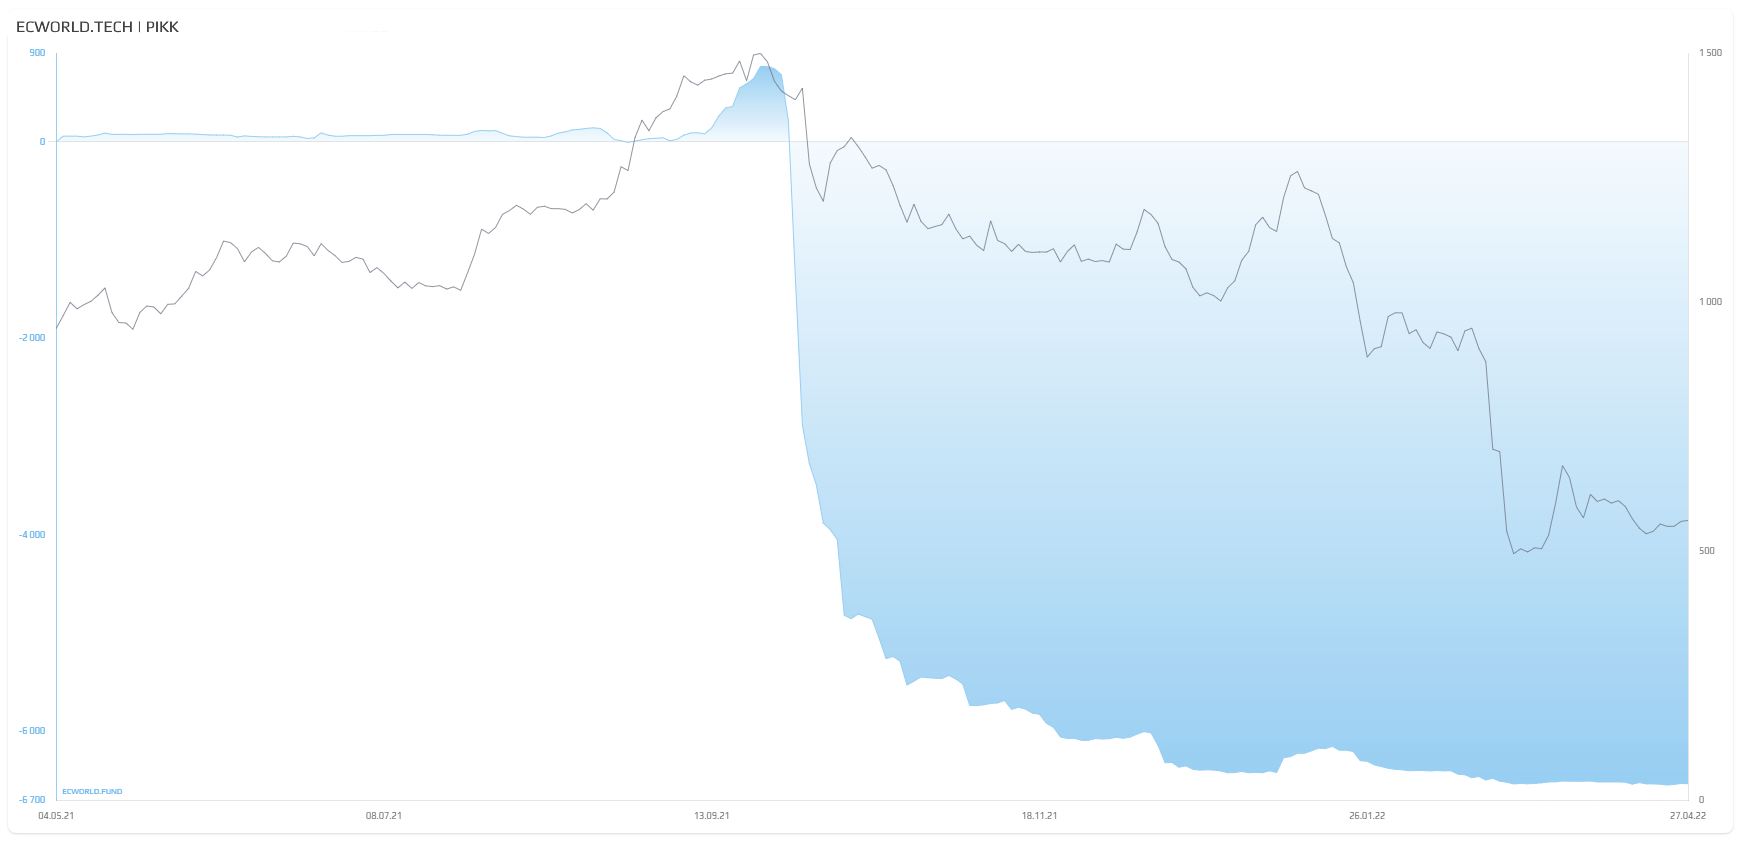
A couple of months later, PIKK shares fell to 380 rubles, a total of -75%. Our Key Stakeholder Sentiment tool (graphical) "showed" in advance, more than a week before the crash, that this company's shares would soon fall sharply.
The example of SBER shares (chart below) clearly shows how, just under a year before the start of the SMO in February 2022—in March 2021, insiders most likely learned in advance of the upcoming geopolitical escalation (the upcoming SMO). As a result, their demand disappeared, and our Key Participants Sentiment tool (shown in blue in the chart below) began to "signal" (the blue wave reversed downwards) an upcoming long-term decline in SBER shares.

At the same time, as the chart shows, key market participants (most likely insiders) began selling shares from long-term portfolios and did so throughout the ongoing rise in the stock (from 280 rubles to 400 rubles per SBER share). Why did the market continue to rise during this period? Because at the same time, millions of individual investors were being driven into the market: bank employees and investment consultants promised investors tens of percent growth, and people closed their accounts and bought up shares. At this time, insiders were most likely selling their shares to individuals—disposing of them. Our Key Participant Sentiment (graphical) tool again "showed" in advance, several months before the crash, that this company's shares would soon fall sharply.
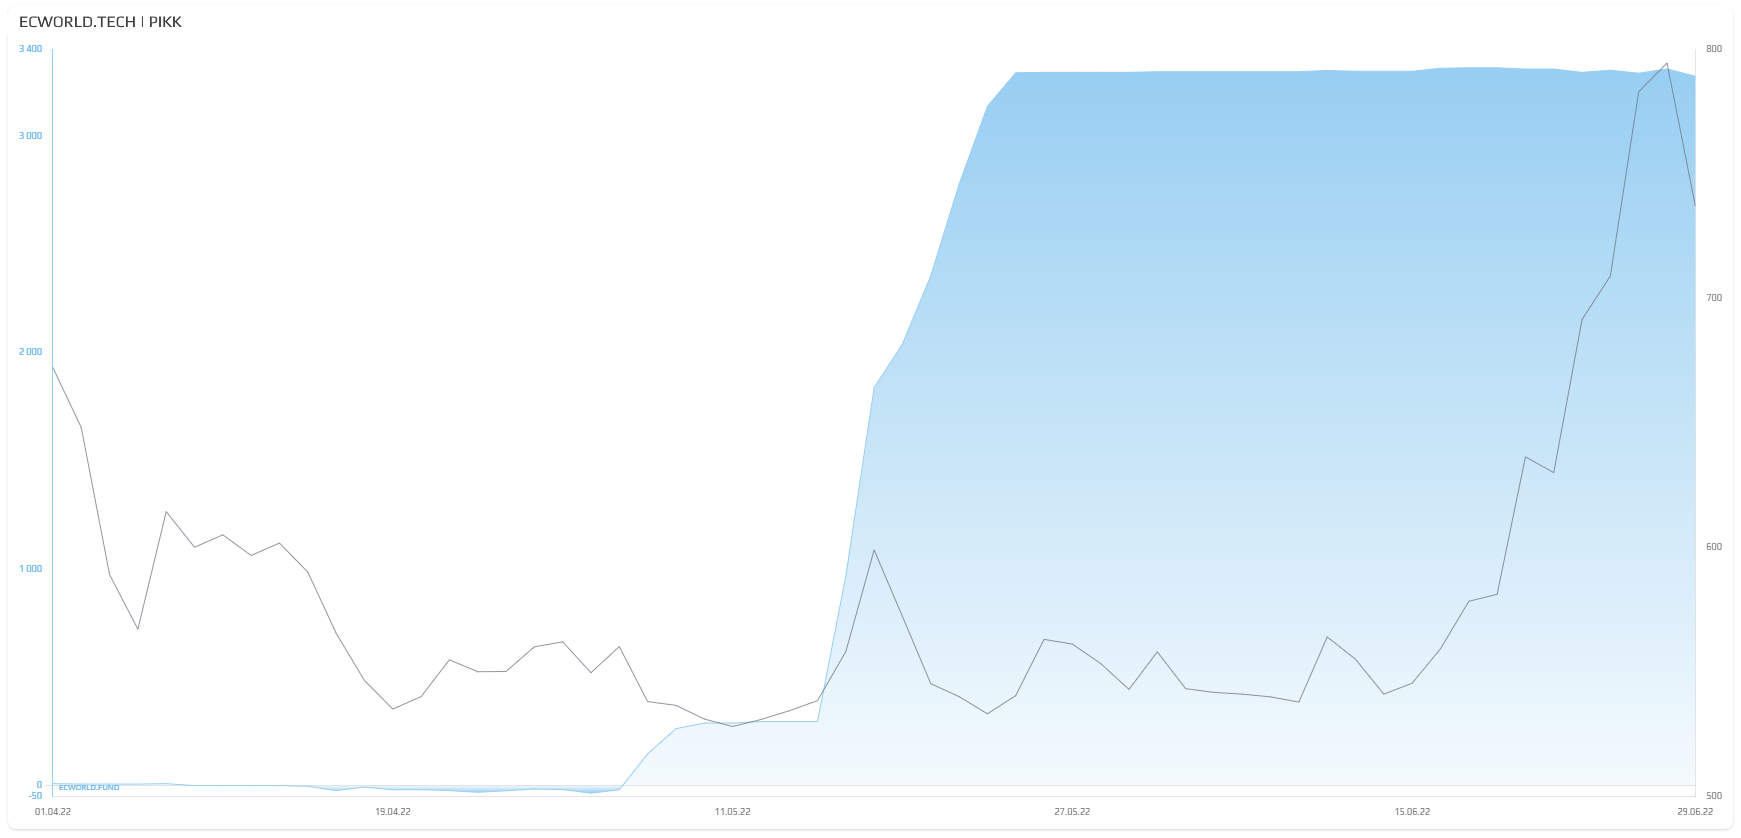
Another example: spring-summer 2022, shares of the same company PIKK. The chart below clearly shows how our Key Participant Sentiment (graphical) tool, in this case demonstrating interest from, most likely, insiders, began to "signal" (the blue wave began to rise) in mid-May about a possible upcoming rise in PIKK shares. A month later, the company's shares began to rise sharply, ultimately increasing their price (gray line in the chart below) from 540 to almost 800 rubles (+48% in a month).
What else did we want to see in our dashboard?
We wanted to see the first impulses in second-tier stocks or thousands of undervalued US stocks, so we could get in first... long before the latest Wall Street Bets and the like started to drive up a stock under the influence of manipulators. We wanted to see in the very first moments (seconds, minutes, hours) what and where exactly these manipulators were doing.
Now, our so-called lists or tops help us with this – for example, the instrument US Stocks, Strong Positive Open or US Stocks, Strong Positive Close:
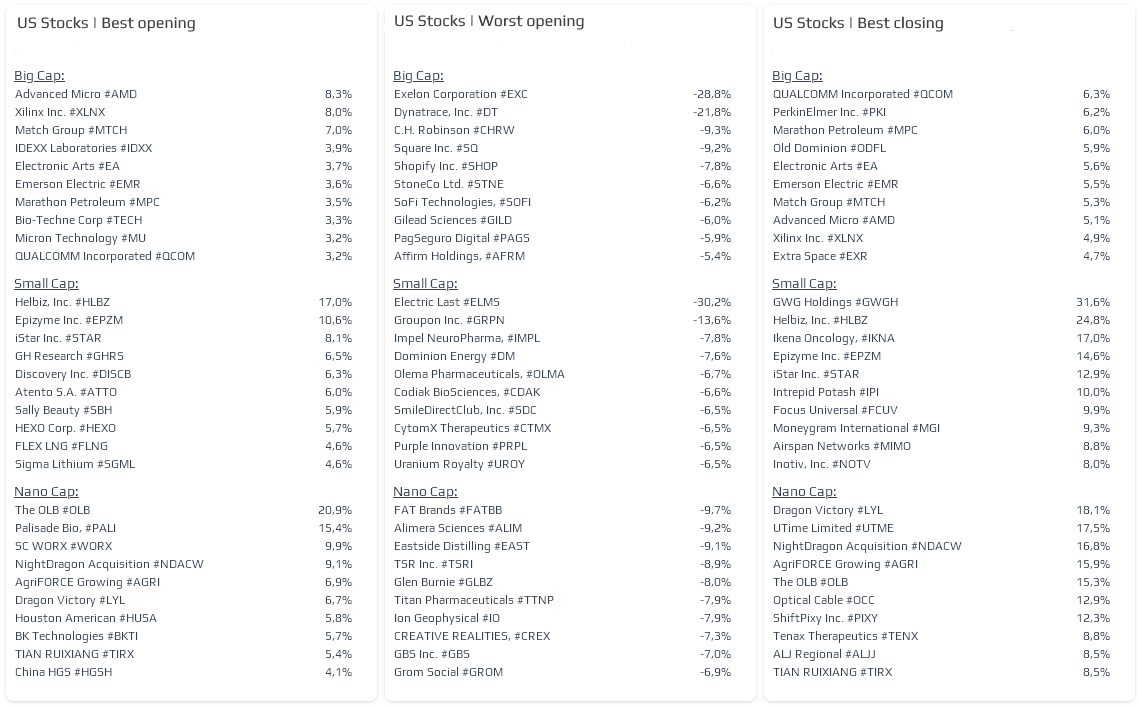
We've created similar lists/tops for the other stock market. They're especially relevant for second-tier stocks, where intraday movements can reach tens of percent. For cryptocurrencies, which are very reactive, there are now similar lists/tops that show which coins/tokens are experiencing impulses – every minute.
More.
We wanted to make money using our skills, experience, and understanding of where, when, and what to focus on—and we did. We made money. We shared useful information through the ECWORLD.FUND project, helping people make money rather than lose it, as evidenced by the results of a survey among a closed group of participants (approximately 2,000 people, out of a total project audience of approximately 100,000):
Is the information about insider/key market participant activity that I publish and that our robots provide useful to you?
- 60% - Yes, it's very useful information
- 21% - Yes, it's useful information
- 13% - It's rather interesting information
- 6% - I haven't yet found it useful
In the coming years, this information will become even more relevant and in demand, because the global financial system will experience significant changes and severe turbulence before the early 2030s, and US- ant other markets will transform from an "investor" market to a "speculator" market.
Understanding the behavior of the "crowd" and that of insiders and professional participants, and taking into account technical factors and seasonality, in previous years we forecasted short- and medium-term market movements and upcoming global events, such as the flash market crash in early 2020 (due to the pandemic), when stocks fell by 40-60% after we sold them at the end of 2019. We didn't fall with the market; we exited stocks early, seeing the shift in sentiment, reversed course, profited from the market decline (short), and only then began buying stocks again. Then, in 2021, we sold our long-term stock portfolios again, seeing insiders (key market participants) exit the market — just before the 2022 downturn.
The information from our dashboard (essentially the work of hundreds of our robots analyzing order books across financial instruments worldwide) allowed us to stay one step ahead of the crowd. We shared this information for many months in publications on ECWORLD.FUND. However, as demand for our tools grew significantly, we limited access to a select group of users working with capital of $2 million. We then simplified some of our tools and made them available to a wider audience. Now, some of the information from our robots has become publicly available to investors—individuals and speculators. As part of this ECWORLD.TECH project,
Now you too can see and understand the market better. See what's really happening, be the first to spot emerging movements, promising stocks, or, conversely, stocks that are about to undergo a significant correction. And not just US stocks, but also currencies, commodities, futures, cryptocurrencies, and more.
ECWORLD.TECH gives you the opportunity to see what others have not yet seen.